Lehrstuhlinhaber
Representation formats

Contact Person: Prof. Dr. Stefanie Rach
Goals:
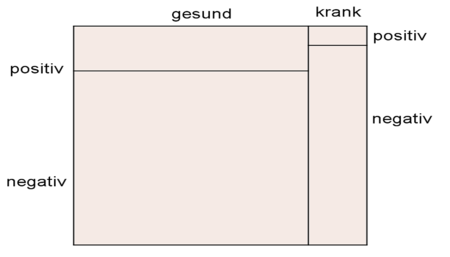
- detailed analysis of the way of representing while introducing “conditional expectation value”
Method:
- implementation of different presentation forms and informational formats in year 10
- questioning pupils about acceptance, preference and quality of (used) presentation forms
Results:
Students prefer tree diagrams with absolute frequencies.
Interest in task and utility value only correlates contigently.
Something to read further:
Rach, S. (2018). Visualisierungen bedingter Wahrscheinlichkeiten - Präferenzen von Schülerinnen und Schülern [Visualization conditional probabilities - Preferences of pupils]. mathematica didactica, 41(1).